Not all aspects of your business processes can be contained within the realm of your ERP. The result: wide-ranging spreadsheets that get deeply embedded into decision-making. Convert your spreadsheet-based processes into a tightly integrated system with EBS in a matter of days.
eWorksheets are so simple, that internal IT in a matter of hours can start configuring powerful reports and applications.
Key Benefits :
Key Features :
 eWorksheets software supports Oracle Cloud Platform
Resource Library :
Case Study: Peregrine reduces audit costs using eWorksheets
Case Study: Sony eliminates redundancies and unnecessary complexities using eWorksheets
Data Sheet: eWorksheets
Scott Rehner, Corporate Vice President of Global Information Technology
|
|
| "GSI Group, Inc. implemented Triniti eWorksheets as part of its global Oracle R12 project across multiple Business Units. Triniti eWorksheets was chosen after evaluation against other software available in the market to build Operational Reports, BI Analytics and Dashboards. eWorksheets will enable GSI with real-time access to EBS data, eliminate spreadsheets, and help to achieve paperless operational reporting. eWorksheets’ self-service capability of creating dynamic filters for slicing and dicing data fits perfectly with the requirements of our business users. With just 10 eWorksheets data models, we were able to cater to 30+ user report requirements across multiple BUs. The business no longer needs to rely solely on the IT team for its ad-hoc reporting needs." |
|
Overview
Triniti has added advanced analytics features to its Excel look-alike reporting platform eWorksheets. Built on Oracle Application Development Framework (ADF), eWorksheets now allows users to explore and visualize data using a variety of charts, maps, and gauges. In its new form, eWorksheets is lightweight and highly responsive.
eWorksheets analytics is fast, lightweight, intuitive, and loaded with options that make it easy for users of all skill sets to explore and visualize their data, from simple line charts to highly detailed combo charts.
Powerful Self-servicing Features
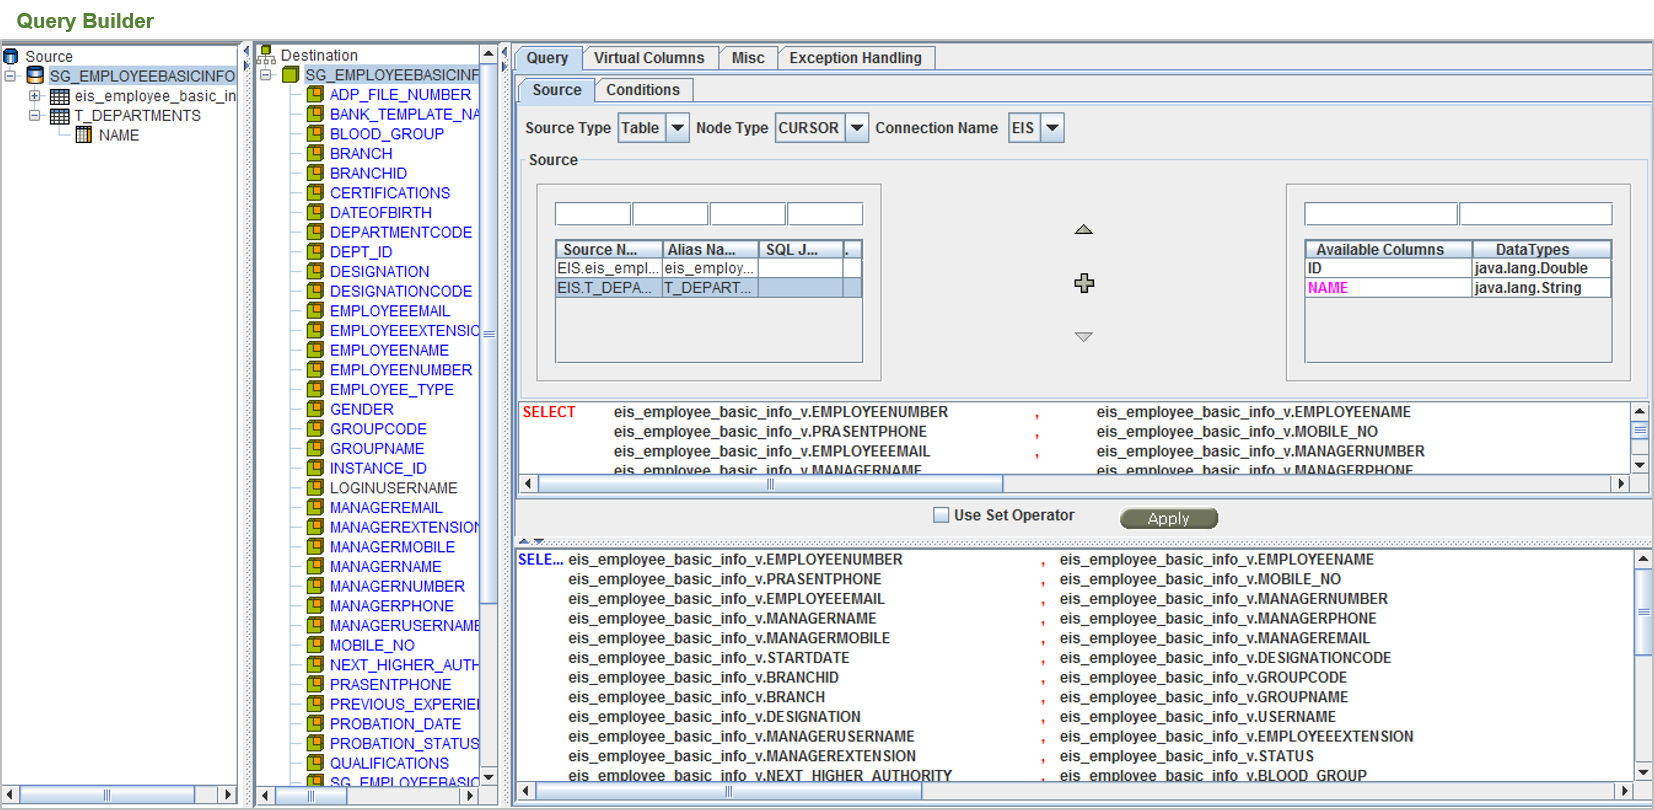
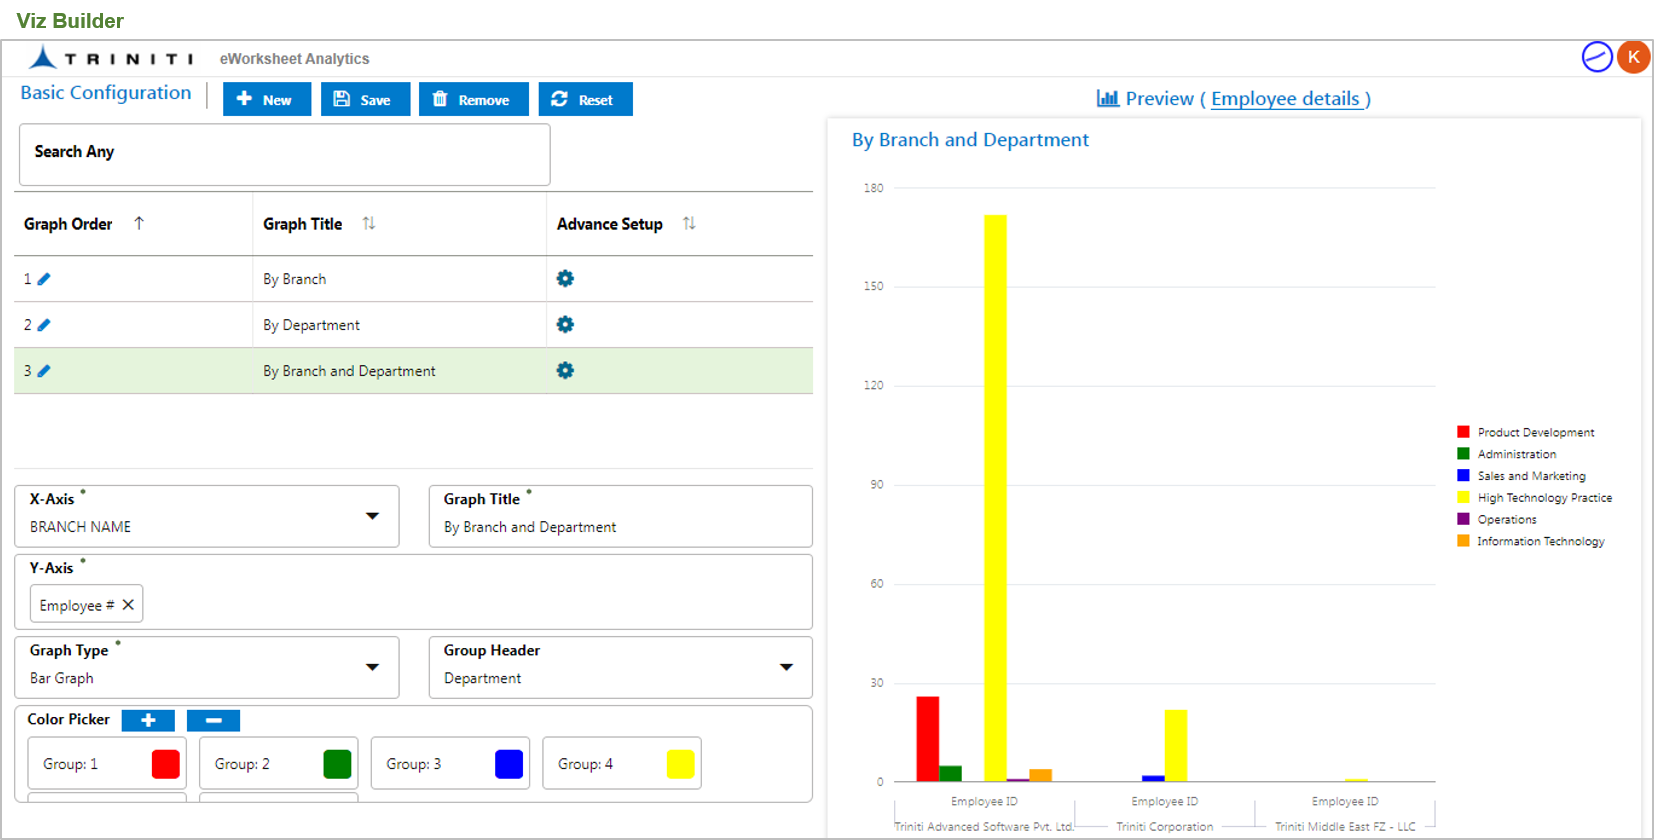
Users can quickly and easily build dashboards using Viz Builder or SQL query builder. Users can format reports, hide/display columns, conditional color formatting of cells, and save them as their own or share it with other users.
Integrates with Modern Databases
eWorksheets Analytics can connect to any SQL-based data source through Java Database Connectivity (JDBC), including modern databases like MongoDB. Column-based queries for large volume aggregations.
Modern Architecture/ No Need for Ingestion Layer
eWorksheets Analytics is lightweight and highly scalable, leveraging the power of your existing data infrastructure without requiring yet another ingestion layer.
Rich Visualizations and Dashboards
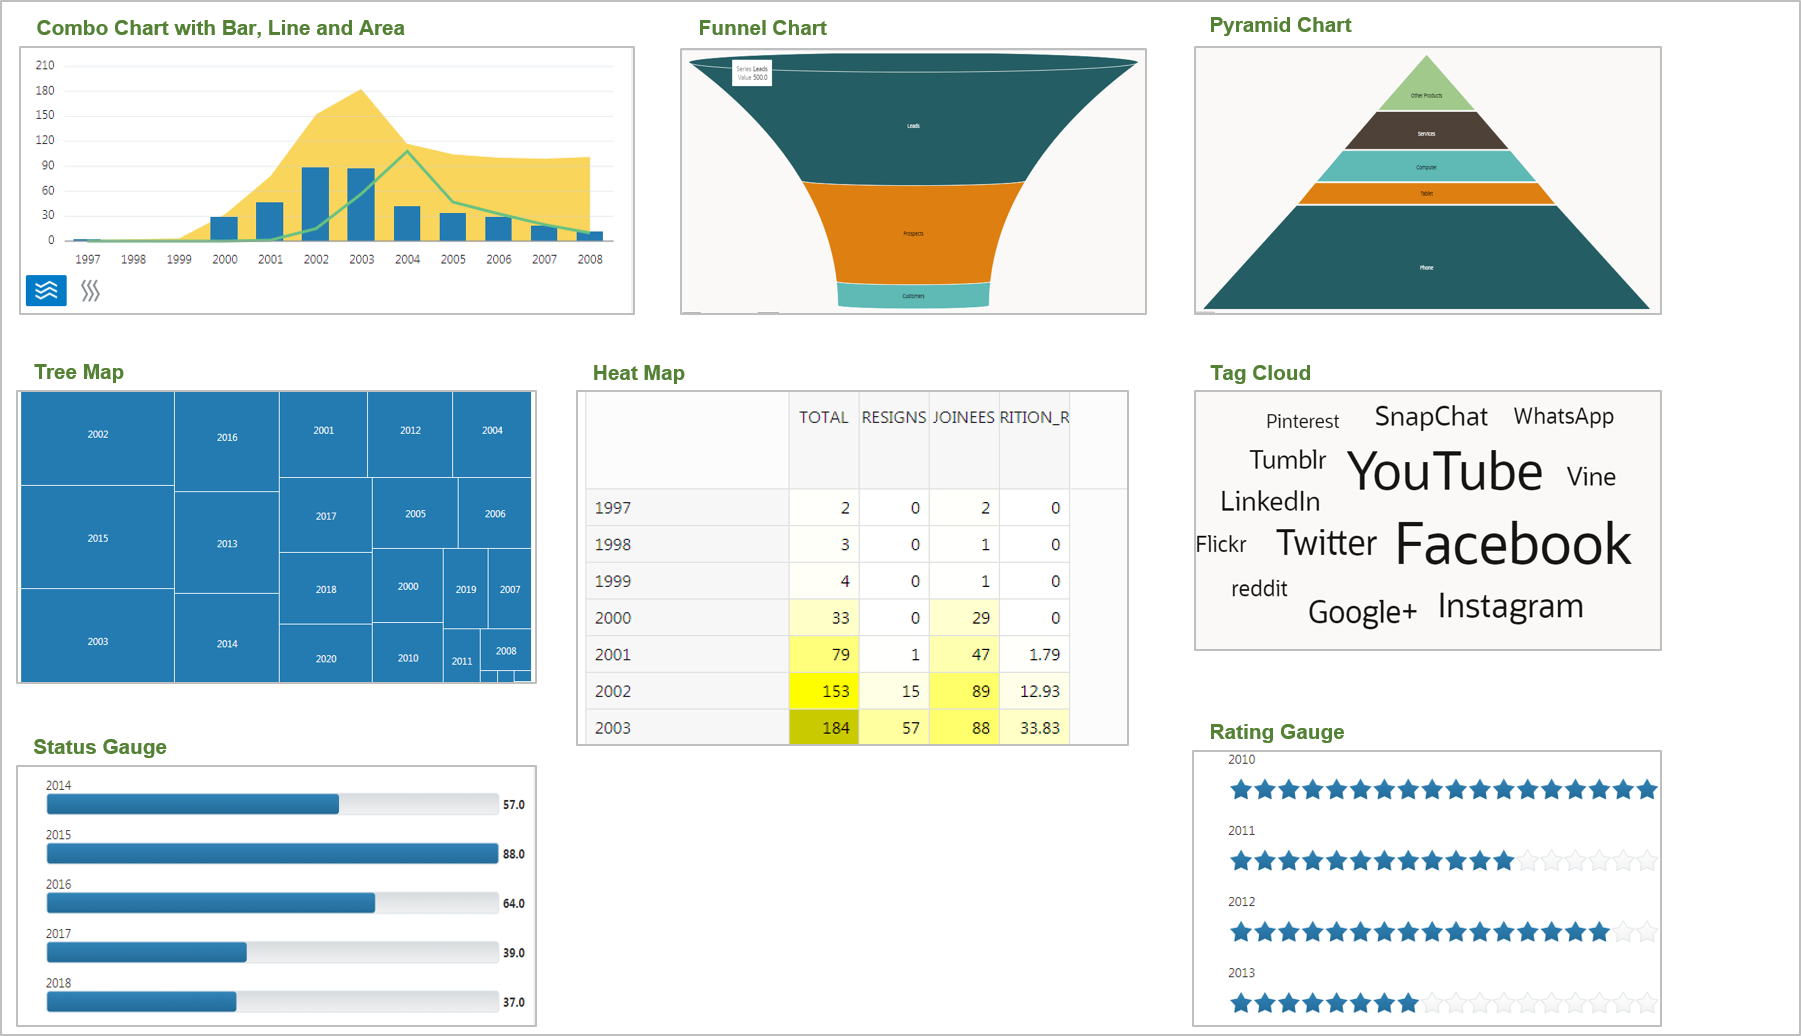
Data and charts can be viewed on a single page simultaneously—interactive Visualization charts with Zoom and Scroll. eWorksheets Analytics ships with a wide array of beautiful visualizations like TreeMap, Heat Map, Tag Cloud, Time Axis & LED / Status / Rating gauges. Drill down to other charts or reports from a part of the Chart.
Technology
Oracle Application Development Framework (ADF) Technology is used with Responsive design as Frontend to show the charts in Desktops and Mobile devices. Java Technology with Java Database Connectivity (JDBC) is used as Middletier to run the Column based SQL queries to fetch data from data sources.
eWorksheets Analytics Provides:
Sample Charts’ Screenshots:
Call 866-531-9587 / Write to info@triniti.com / Fill out the contact form.