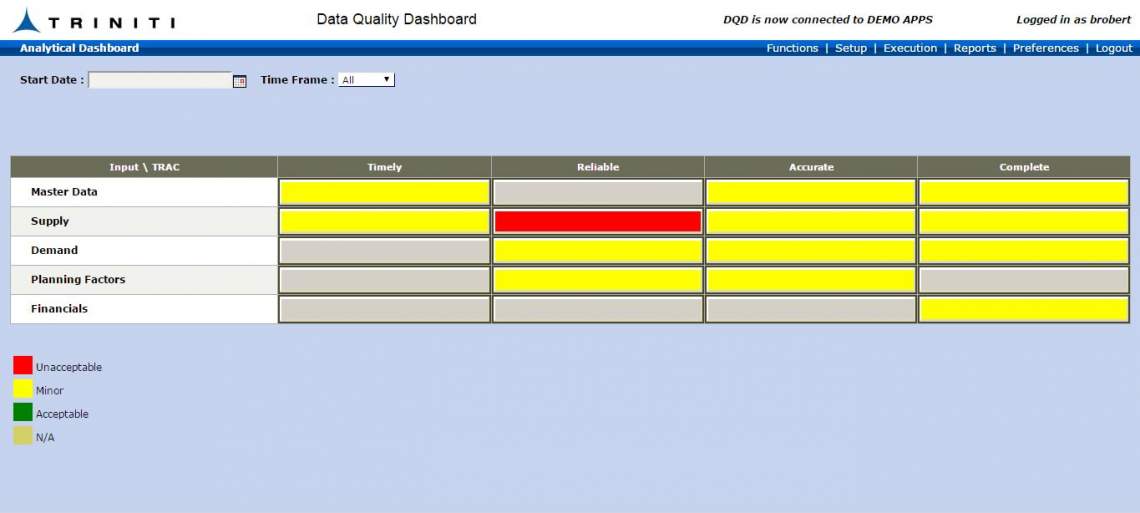
Triniti's Data Quality Dashboard is a user-friendly web application which monitors Data Quality Indictors (DQIs) and provides analytical dimensions - Timely, Reliable, Accurate and Complete, across Master data, demand, suuply, planning factors an financial areas to ensure that the business processes produce accurate data quality. This tool also monitors the stability of the system infrastructure used throughout the enterprise. DQD also provides a repeatable, sustainable, and efficient planning environment with high quality data.
Keep information about your current data quality state readily available for faster improved decision making. Set up the customizable dashboard using predefined and custom metrics.
The dashboard allows user to view data metrics and their historical trends and monitor data quality on a continuous basis. This enables business users and data stewards to address the root cause for poor data quality and measure the effectiveness of the Master Data Management (MDM) program.
The screenshot below illustrates Data Quality Indicator results data in a tabular format for DQI - "Buy Items that do not have an Approved Supplier List". Track problems to their source by drilling down to original records, and quickly understand the cause of invalid data.

The screenshot below illustrates Data Quality Indicator results trends. See trends, view history, and get accurate and timely visual reports shared across your entire organization.

Scheduled / Custom Data Quality Checks
Develop Custom DQIs as per business process
Configurable timely Email alerts to business users
Measure and study quality trend using graphs
Customizable dashboard (New vertical / horizontal dimensions are configurable)
Enables Users of ERP, ASCP, Business Intelligence and Reporting tools to TRUST all data
Prevents catastrophic data errors from being used by Planning Engine
Eliminates need for extensive verification of planning output
Reduces need for manual override of planning output
Pro-active analytic DQIs drive robust business processes for data creation and maintenance
Source systems are updated as errors are corrected, resolving the original faulty data
Makes owners of data elements accountable to maintain data quality
Triniti's Data Quality Dashboard (DQD) for Oracle EBusiness Suite is an essential part of the Triniti multi-domain MDM suite and ensures that you maximize benefits of both MDM and ERP investments. The dashboard allows the user to view data metrics and their historical trends and monitor data quality on a continuous basis. This enables users and stewards to address the root cause for poor data quality and measure the effectiveness of the MDM program.
Items, BOMs, Routing, customer, supplier are examples master data elements, Sales Orders, Forecast, Demantra signals are examples of Demand data elements. Requisitions, purchase orders, Work in Process, Inventory are examples Supply data elements. Lead times, capacity, Yield, Firm Supplies, Planning Time Fence, Demand Time Fence, Calendar, Resource Shifts, Simulation Sets, Profile options, Planning Buckets are examples of planning factor data elements. Orphan accounts are an example financial data element. They are categorized under vertical dimensions Timely, reliable, accurate and complete. The reliability dimension is calculated automatically based on the other three vertical dimensions. This dimension reflects the trust that the users should have on the quality of the data.
Triniti DQD comes embedded with more than 300 DQIs. You can add your own DQI. Alerts can also be configured for the DQIs and add routed to a contact person. Alerts are sent by email. You can drill down to all the errors that contribute to poor data quality. Historical trends are displayed with graphs.
Play the video to know more about Triniti's Data Quality Dashboard.
Call 866-531-9587 / Write to info@triniti.com / Fill out the contact form.